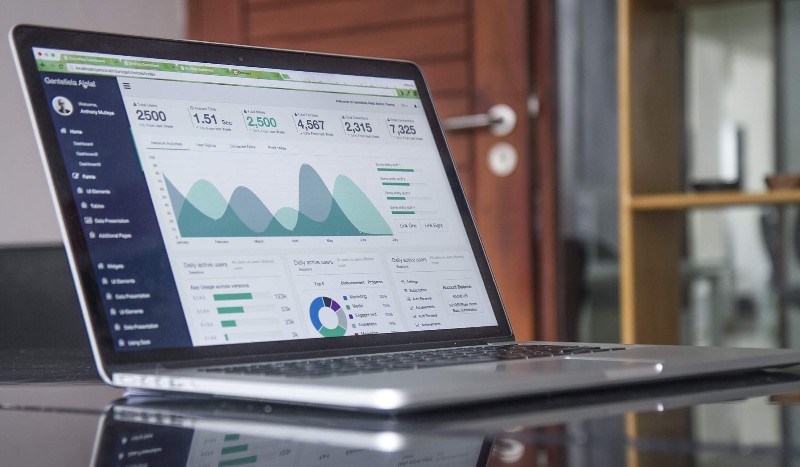
A Key Performance Indicator (KPI) is a performance evaluation tool that illustrates the degree to which a desired parameter is being achieved, as well as how efficiently and quickly this is happening.
In the 21st century, most organizations have as their main growth strategy the use of key performance indicators to achieve their goals. Selecting the right KPI for your business depends on where you operate and what part of your business you want to grow in the next 3, 6, or 12 months.
It would be essential that within an organization, each department uses different KPIs to be able to measure progress against specific business targets. The next step after establishing and implementing all the right KPIs for your business is to track them in real-time so you can see any changes along the way. For the effective tracking of KPIs, a dashboard is used through which all information regarding the department, activity, progress, or any other necessary detail on the way to achieving the business objectives can be tracked.

Why do we need KPIs?
If we don't know ourselves or set our KPIs, it means we don't have direction and clarity. Typically, these online KPIs are of two types:
- Micro conversions: A certain number of Clicks, Interactions, Impact, Impressions, CPM, subscribe to the newsletter, create an account, add a product to the cart, etc.
- Macro conversions: An online sale, A user adding a product to the cart, A user adding an item to the wishlist, any KPI (performance metric) that the company considers valuable.
Top online campaign performance metrics you need to track to get good results online. For advertising campaigns:
- Reach - is defined as the total number of users to whom the content of the online campaign was displayed, i.e., the actual number of people to whom the ad was displayed.
- Frequency - is defined as the number of impressions directed to a single user.
- Cost Per (X), % - is defined separately, for a certain final KPI, depending on the objective. For example, for app installs: Cost per Install, for Google Search: Cost per Click, for Video Campaigns: Cost per View.
- Customer Lifetime Value (CLV) is defined as the amount of an average order that takes place on a website or in an application.
CLV =Average value of a sale * number of transactions * loyalty period
- ROI – return on investment – the percentage of the investment that returns to the person making that investment. It is calculated as the volume of revenue generated for each dollar invested in the campaign.
For user experience on the website:
- Average time spent on site - The average time spent by all users on a single page. To calculate it, Google Analytics adds the duration of each session over the specified period and divides it by the total number of sessions.
- Returning Website Visitors - Indicates the engagement rate as visitors return.
- Traffic Channels - Shows how people find your website/landing page.
- Total number of visits. The number of unique browsing sessions by the number of individual visitors to the site.
- Total number of unique visitors. Number of people who visited the website/landing page.
- Click-through rate (CTR). The percentage of people who clicked on a CTA button or link.
- ROI - return on investment - is the percentage of the investment that returns to the person making that investment. It is calculated as the volume of revenue generated for each dollar invested in the campaign.
Where do we get the data for KPI analysis?
- We use historical data from Google Analytics (demographic statistics about website visitors, which can be further segmented/grouped based on different criteria: devices, city, traffic source, campaign, website behavior), Google Search Console, Real user data from Facebook, Facebook Custom Audience (audience based on a certain type of interaction with the brand: page like, message, website visitor).
- The latest and current estimates - here you can compare yourself to your competitors, using tools that estimate the results of their campaigns, such as:
Similarweb - data about traffic sources, global and local ranking of the site, traffic volume, positioning, and keywords for SEO.
SEMRush - positions in search engines, and how much traffic they get from these positions.
Tracking key performance indicators helps you know both successes and challenges in your business to make the best decisions for your business, day in and day out.

What performance indicators do you track in your online business?
